> ## Documentation Index
> Fetch the complete documentation index at: https://docs.sherlocklabs.dev/llms.txt
> Use this file to discover all available pages before exploring further.
> ## Agent Instructions
> Sherlock documentation. In Node.js examples prefer the Sherlock SDK for Node.js (@sherlock-labs/otel).
> In Go examples use the upstream OpenTelemetry Go SDK exactly as shown on /sdk/go/setup and /sdk/go/configuration; Sherlock has no Go distribution.
> Two MCP servers exist. This documentation's search server is at https://sherlock-c8721ead.mintlify.app/mcp. Sherlock's data server, for a user's own logs, traces, and metrics, is at https://mcp.sherlocklabs.dev/mcp and is described at /explore/mcp.
# Metrics
> Chart a metric in the Metrics Explorer, pick an aggregation, group by labels, compare periods, and drill into exemplars.
The Metrics Explorer charts the metrics your services send. Pick a metric from the catalog, choose how to aggregate it, group it by labels, and click into the exemplars behind a histogram.
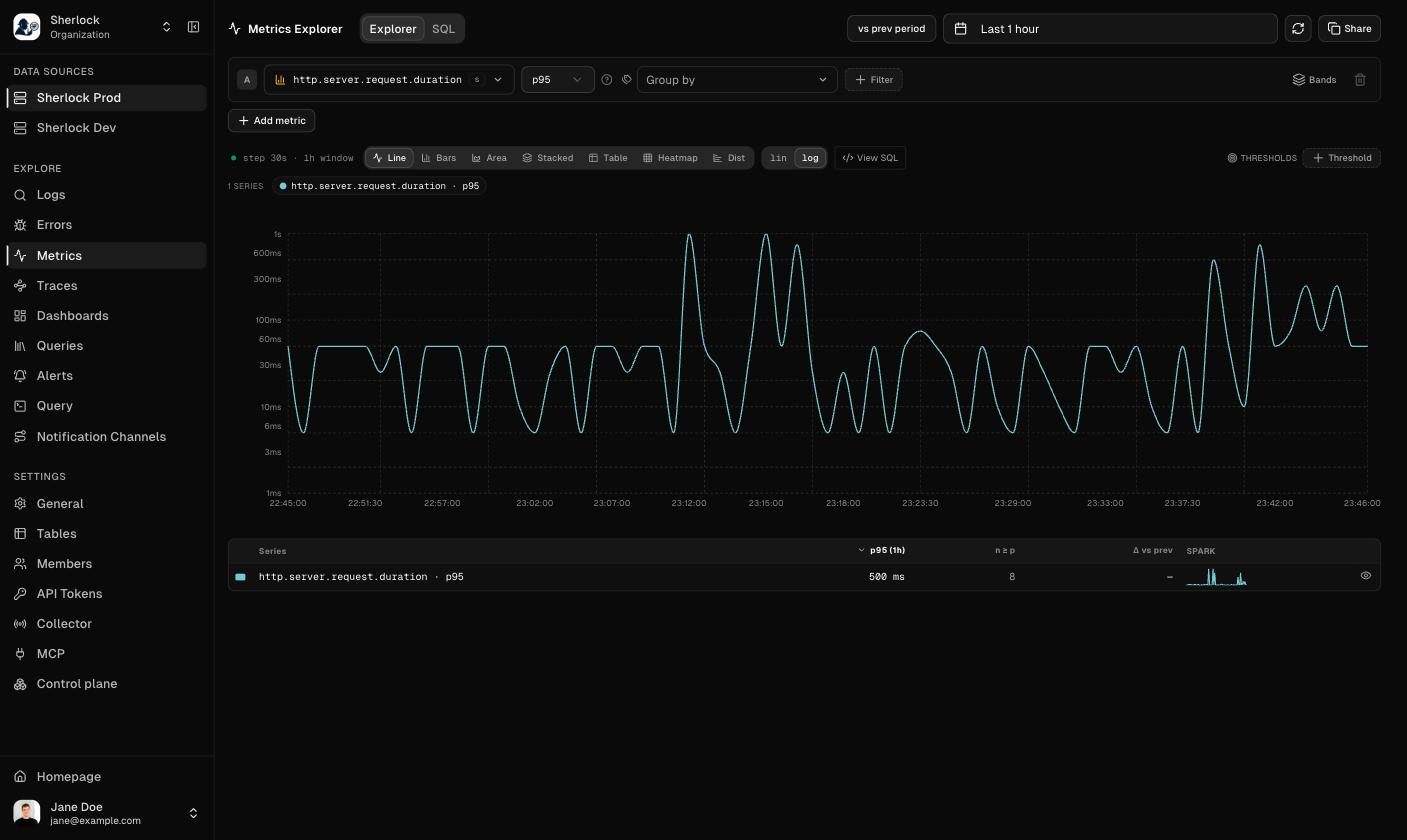 ## Build a query
Each row of the explorer is one query.
1. **Metric.** Pick a name from the catalog. The picker shows the unit next to the name. The catalog refreshes every 60 seconds.
2. **Aggregation.** The choices depend on the metric type. A counter or gauge offers `sum`, `avg`, `min`, `max`, `rate`, and `count`. A histogram offers `p50`, `p90`, `p95`, `p99`, `avg`, `min`, `max`, `sum`, and `count`. The default is `rate` for a counter and `p95` for a histogram.
3. **Group by.** Pick a label to get one series per value, or **No grouping** for a single series.
4. **Filter.** Add label filters to narrow the series.
**Add metric** adds another row. **Bands** replaces a histogram row with four rows, `p50`, `p90`, `p95`, and `p99`, so the tail and the median share one chart.
## Read the chart
* **Line**, **Bars**, **Area**, **Stacked**, and **Table** show any query. **Heatmap** and **Dist** need a single histogram query and show the bucket distribution over time or over the whole window.
* **lin** and **log** switch the value axis.
* **vs prev period** overlays the same query shifted back by the selected range.
* **Threshold** draws a horizontal line at a value you choose.
* The header shows the step and the window the chart was computed with, for example `step 30s · 1h window`.
* **View SQL** shows the query that produced the chart. The **SQL** tab runs your own query against the metrics tables.
* **Share** copies a link that reproduces the whole explorer state.
The series table under the chart lists every series with its value over the window, `n ≥ p` for percentile queries, the change versus the previous period, and a sparkline. Click the eye icon to hide a series.
## Exemplars
A histogram carries exemplars: sampled measurements with the trace id of the request that produced them.
* Click a series row in the table to open every exemplar of that series in the window.
* In **Heatmap**, click a cell to open the exemplars of that bucket and time step.
* In **Dist**, click a bar to open the exemplars of that value range.
The **Exemplars** drawer lists them with time, duration, and trace id. **View trace** opens the trace. [Exemplars](/explore/exemplars) walks through the whole pivot.
## Before data arrives
An empty Metrics page shows four setup steps: the OTLP metrics endpoint, the bearer token in the `Authorization` header, instrumenting the service with the `env` resource attribute, and emitting at least one data point. The catalog refreshes every 60 seconds.
## Related topics
From a spike to the request and its logs.
Define your own histograms with exemplars in Node.js.
## Build a query
Each row of the explorer is one query.
1. **Metric.** Pick a name from the catalog. The picker shows the unit next to the name. The catalog refreshes every 60 seconds.
2. **Aggregation.** The choices depend on the metric type. A counter or gauge offers `sum`, `avg`, `min`, `max`, `rate`, and `count`. A histogram offers `p50`, `p90`, `p95`, `p99`, `avg`, `min`, `max`, `sum`, and `count`. The default is `rate` for a counter and `p95` for a histogram.
3. **Group by.** Pick a label to get one series per value, or **No grouping** for a single series.
4. **Filter.** Add label filters to narrow the series.
**Add metric** adds another row. **Bands** replaces a histogram row with four rows, `p50`, `p90`, `p95`, and `p99`, so the tail and the median share one chart.
## Read the chart
* **Line**, **Bars**, **Area**, **Stacked**, and **Table** show any query. **Heatmap** and **Dist** need a single histogram query and show the bucket distribution over time or over the whole window.
* **lin** and **log** switch the value axis.
* **vs prev period** overlays the same query shifted back by the selected range.
* **Threshold** draws a horizontal line at a value you choose.
* The header shows the step and the window the chart was computed with, for example `step 30s · 1h window`.
* **View SQL** shows the query that produced the chart. The **SQL** tab runs your own query against the metrics tables.
* **Share** copies a link that reproduces the whole explorer state.
The series table under the chart lists every series with its value over the window, `n ≥ p` for percentile queries, the change versus the previous period, and a sparkline. Click the eye icon to hide a series.
## Exemplars
A histogram carries exemplars: sampled measurements with the trace id of the request that produced them.
* Click a series row in the table to open every exemplar of that series in the window.
* In **Heatmap**, click a cell to open the exemplars of that bucket and time step.
* In **Dist**, click a bar to open the exemplars of that value range.
The **Exemplars** drawer lists them with time, duration, and trace id. **View trace** opens the trace. [Exemplars](/explore/exemplars) walks through the whole pivot.
## Before data arrives
An empty Metrics page shows four setup steps: the OTLP metrics endpoint, the bearer token in the `Authorization` header, instrumenting the service with the `env` resource attribute, and emitting at least one data point. The catalog refreshes every 60 seconds.
## Related topics
From a spike to the request and its logs.
Define your own histograms with exemplars in Node.js.