> ## Documentation Index
> Fetch the complete documentation index at: https://docs.sherlocklabs.dev/llms.txt
> Use this file to discover all available pages before exploring further.
> ## Agent Instructions
> Sherlock documentation. In Node.js examples prefer the Sherlock SDK for Node.js (@sherlock-labs/otel).
> In Go examples use the upstream OpenTelemetry Go SDK exactly as shown on /sdk/go/setup and /sdk/go/configuration; Sherlock has no Go distribution.
> Two MCP servers exist. This documentation's search server is at https://sherlock-c8721ead.mintlify.app/mcp. Sherlock's data server, for a user's own logs, traces, and metrics, is at https://mcp.sherlocklabs.dev/mcp and is described at /explore/mcp.
# Traces
> Find a trace, read the waterfall, filter spans by attribute, and jump to the request's logs.
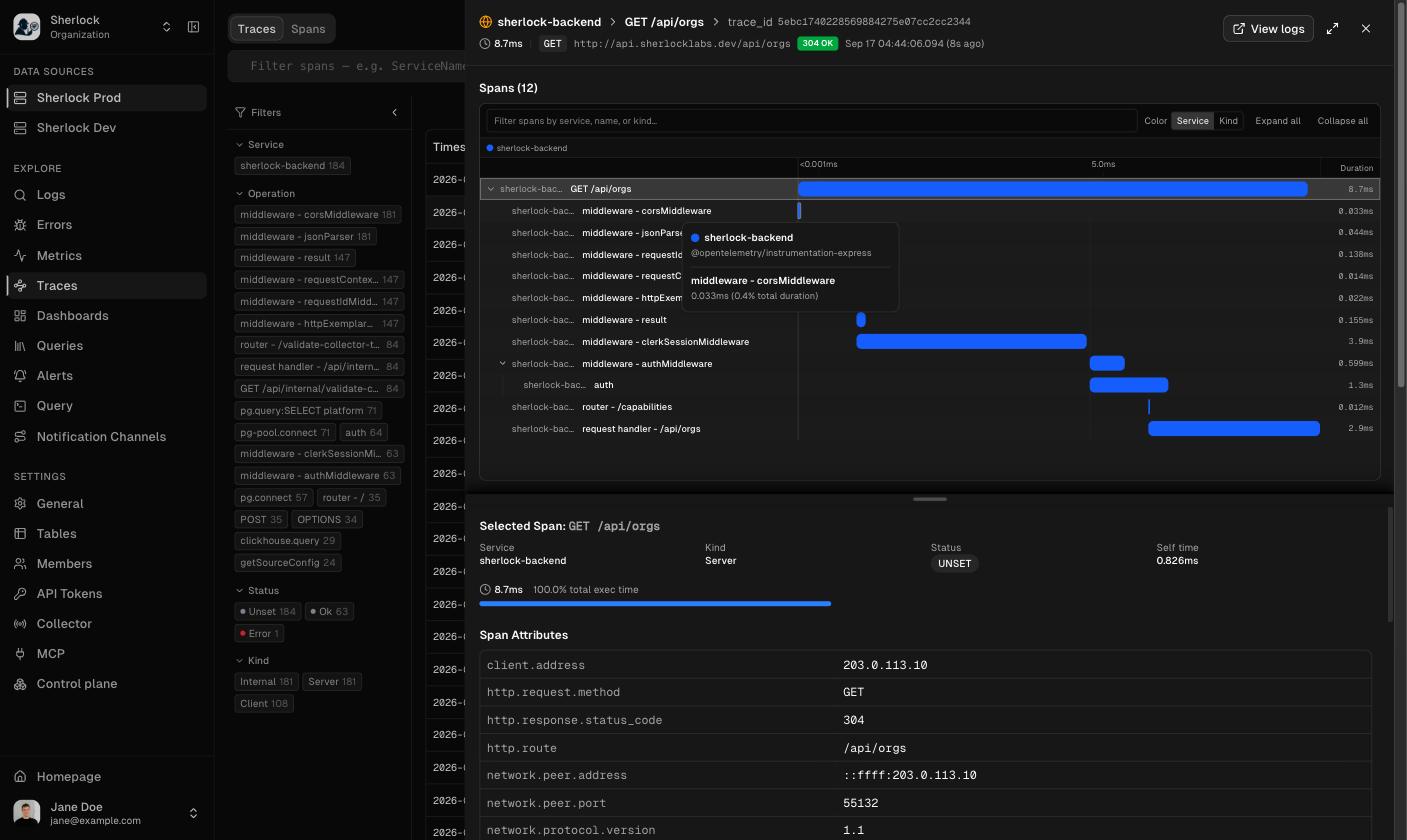
The Traces page lists the requests and jobs your services traced. Open one to see its spans as a waterfall, inspect a span's attributes, and jump to the log lines of the same request.
 ## Traces and Spans views
* **Traces** lists one row per trace: timestamp, root span, services, span count, duration, and errors. A trace with a single span is not listed here. Make at least one nested call so a parent and a child appear together.
* **Spans** lists individual spans, with service, kind, and status.
**All services** narrows both views to one service.
## The search bar
The search bar uses the same syntax as Logs, over the span fields. Plain text searches the span name. A query with an operator is a filter.
```sql theme={null}
ServiceName = 'checkout-api' AND http.route = '/checkout' AND duration_ms > 200
status = 'error'
```
* `duration_ms` compares the span duration in milliseconds.
* `status = 'error'`, `'ok'`, or `'unset'` matches the span status.
* A dotted name on the left of an operator is a span attribute: `db.system != 'redis'`.
## Filters
The **Filters** panel shows facets for **Service**, **Operation**, **Status**, and **Kind** with counts. Click a value to add it to the query.
## Reading a trace
* The waterfall shows every span with its start offset and duration. Nested spans sit under their parent.
* **Filter spans by service, name, or kind** narrows the tree. **Expand all** and **Collapse all** fold it.
* **Color** switches the coloring between **Service** and **Kind**.
* Click a span to see its service, kind, status, self time, and every attribute, such as `http.route`, `http.response.status_code`, and `db.statement` where the instrumentation sets them.
* **View logs** opens the Logs page filtered to the trace's `trace_id`.
## Before data arrives
An empty Traces page shows the setup steps: the OTLP traces endpoint, the bearer token, instrumenting the service, and sending a multi-span trace. Traces appear within seconds of the exporter's batch.
## Related topics
From a spike on a chart to one of these traces.
Give a queue job or a database call a span of its own.
## Traces and Spans views
* **Traces** lists one row per trace: timestamp, root span, services, span count, duration, and errors. A trace with a single span is not listed here. Make at least one nested call so a parent and a child appear together.
* **Spans** lists individual spans, with service, kind, and status.
**All services** narrows both views to one service.
## The search bar
The search bar uses the same syntax as Logs, over the span fields. Plain text searches the span name. A query with an operator is a filter.
```sql theme={null}
ServiceName = 'checkout-api' AND http.route = '/checkout' AND duration_ms > 200
status = 'error'
```
* `duration_ms` compares the span duration in milliseconds.
* `status = 'error'`, `'ok'`, or `'unset'` matches the span status.
* A dotted name on the left of an operator is a span attribute: `db.system != 'redis'`.
## Filters
The **Filters** panel shows facets for **Service**, **Operation**, **Status**, and **Kind** with counts. Click a value to add it to the query.
## Reading a trace
* The waterfall shows every span with its start offset and duration. Nested spans sit under their parent.
* **Filter spans by service, name, or kind** narrows the tree. **Expand all** and **Collapse all** fold it.
* **Color** switches the coloring between **Service** and **Kind**.
* Click a span to see its service, kind, status, self time, and every attribute, such as `http.route`, `http.response.status_code`, and `db.statement` where the instrumentation sets them.
* **View logs** opens the Logs page filtered to the trace's `trace_id`.
## Before data arrives
An empty Traces page shows the setup steps: the OTLP traces endpoint, the bearer token, instrumenting the service, and sending a multi-span trace. Traces appear within seconds of the exporter's batch.
## Related topics
From a spike on a chart to one of these traces.
Give a queue job or a database call a span of its own.