

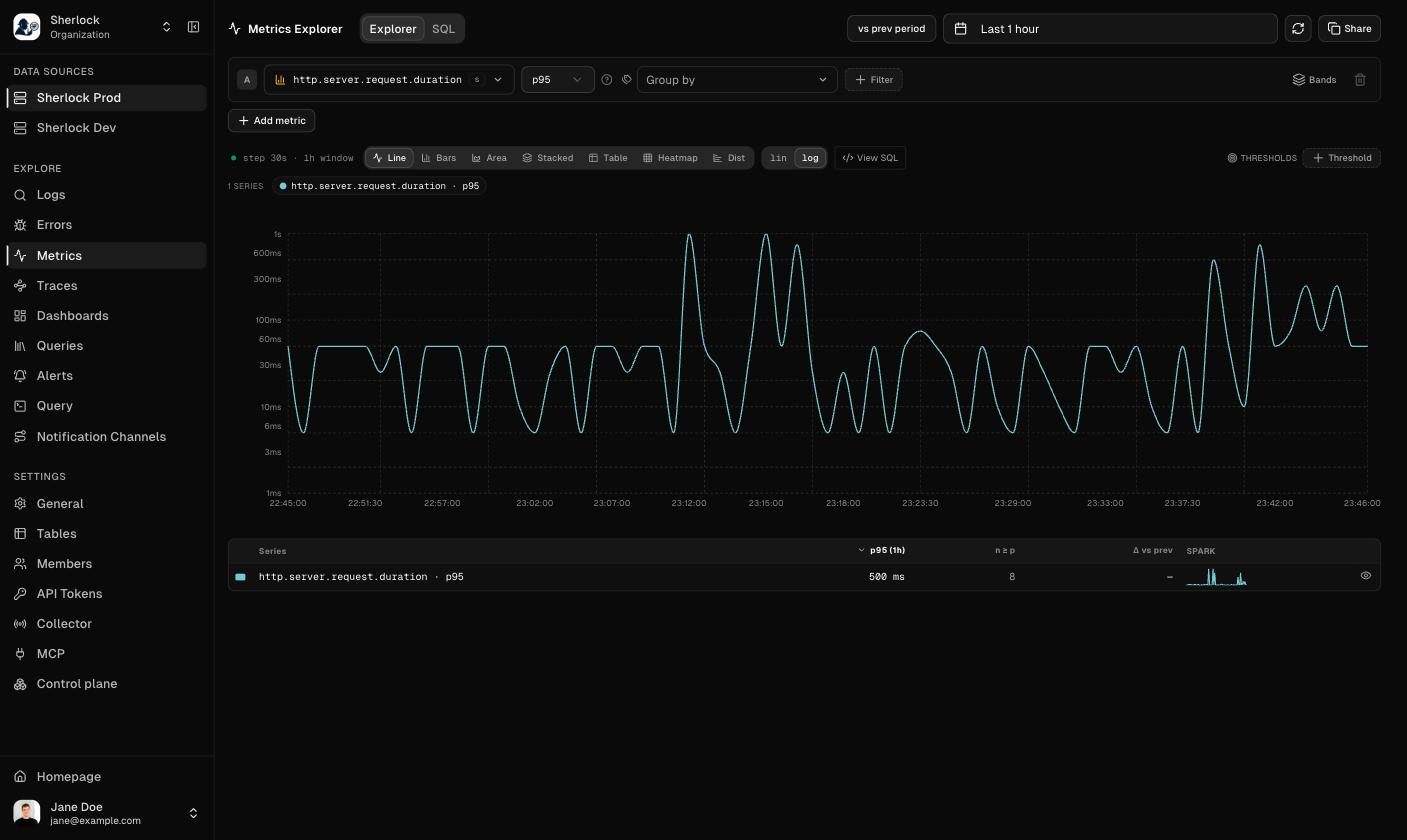
The Metrics Explorer charting the p95 of http.server.request.duration
Build a query
Each row of the explorer is one query.- Metric. Pick a name from the catalog. The picker shows the unit next to the name. The catalog refreshes every 60 seconds.
- Aggregation. The choices depend on the metric type. A counter or gauge offers
sum,avg,min,max,rate, andcount. A histogram offersp50,p90,p95,p99,avg,min,max,sum, andcount. The default isratefor a counter andp95for a histogram. - Group by. Pick a label to get one series per value, or No grouping for a single series.
- Filter. Add label filters to narrow the series.
p50, p90, p95, and p99, so the tail and the median share one chart.
Read the chart
- Line, Bars, Area, Stacked, and Table show any query. Heatmap and Dist need a single histogram query and show the bucket distribution over time or over the whole window.
- lin and log switch the value axis.
- vs prev period overlays the same query shifted back by the selected range.
- Threshold draws a horizontal line at a value you choose.
- The header shows the step and the window the chart was computed with, for example
step 30s · 1h window. - View SQL shows the query that produced the chart. The SQL tab runs your own query against the metrics tables.
- Share copies a link that reproduces the whole explorer state.
n ≥ p for percentile queries, the change versus the previous period, and a sparkline. Click the eye icon to hide a series.
Exemplars
A histogram carries exemplars: sampled measurements with the trace id of the request that produced them.- Click a series row in the table to open every exemplar of that series in the window.
- In Heatmap, click a cell to open the exemplars of that bucket and time step.
- In Dist, click a bar to open the exemplars of that value range.
Before data arrives
An empty Metrics page shows four setup steps: the OTLP metrics endpoint, the bearer token in theAuthorization header, instrumenting the service with the env resource attribute, and emitting at least one data point. The catalog refreshes every 60 seconds.
Related topics
Exemplars
From a spike to the request and its logs.
Custom metrics
Define your own histograms with exemplars in Node.js.